Next-Generation Fluid Intelligence for Data Centre Cooling Infrastructure
Next-Generation Fluid Intelligence for Data Centre Cooling Infrastructure
Advanced Electrical Impedance Sensing for Real-Time Coolant Monitoring, Corrosion Prevention, and Sustainability Compliance
Executive Summary
The rapid escalation of AI rack power densities to 100–250 kW has made the transition from air to liquid cooling mandatory. However, this shift introduces "blind" risks: fluid degradation, corrosion, and biofouling that legacy monitoring — such as manual refractometry, grab sampling and conductivity — is too slow to detect. With downtime costs averaging $9,000 per minute, reactive maintenance is no longer viable.
4T2 Sensors address this gap through advanced monochromatic Electrical Impedance sensing. By measuring both the real (conductivity) and imaginary (capacitance) components of a fluid's electrical impedance simultaneously, the technology delivers a level of diagnostic depth that no legacy sensor can match. Three core capabilities have been experimentally validated:
① Glycol:Water Composition
Continuous, high-resolution detection of dilution events; far faster and more accurate than manual refractometry.
② Corrosion Inhibitor Film Presence
Detection of organic acid (OAT) film formation at concentrations as low as 400 ppm and inorganic phosphate films at 50 ppm.
③ Biofilm Detection
Measurement of the double-layer capacitance shift caused by EPS-secreting biofilms on electrode surfaces, enabling early fouling alerts.
The result is a platform capable of flagging coolant degradation, inhibitor depletion, and biological fouling in real time; long before conventional monitoring detects a problem. In an industry where a single hour of unplanned downtime can cost over $6.5 million, continuous fluid intelligence is no longer optional.
Additionally this platform enables a move to condition-based maintenance, extending coolant lifespans to 8–10 years and providing the empirical data necessary to meet strict WUE and EED regulatory mandates.
Introduction
The rapid growth of artificial intelligence (AI), machine learning, and high-performance computing (HPC) has fundamentally altered the thermal profile of modern digital infrastructure. As rack power densities escalate from historical enterprise averages of 5–15 kW to upward of 100–250 kW for AI workloads, traditional air-cooling methodologies have reached their physical, thermodynamic, and economic limits. In response, the data centre industry has aggressively pivoted toward liquid cooling architectures, including direct-to-chip (D2C) cold plates and immersive cooling systems, which offer vastly superior thermal transfer capabilities.
However, the integration of liquid cooling introduces significant operational vulnerabilities related to fluid degradation, corrosion and biofouling within the cooling loops. Simultaneously, the sheer volume of water and chemical coolants required to sustain hyperscale facilities has triggered intense regulatory and societal scrutiny. Global AI water demand is projected to reach between 4.2 and 6.6 billion cubic metres annually by 2027; an amount equivalent to four to six times Denmark's total annual water withdrawal. In the United Kingdom alone, government reports warn of a structural daily water deficit of nearly 5 billion litres by 2050. Regulatory frameworks such as the EU's Energy Efficiency Directive (EED) and the Climate Neutral Data Centre Pact (CNDCP) now mandate strict reporting on Water Usage Effectiveness (WUE) and Power Usage Effectiveness (PUE).
To navigate these compounding thermal, chemical, and regulatory pressures, data centre operators must transition from reactive, schedule-based maintenance to predictive, continuous fluid monitoring. Advanced Electrical Impedance Spectroscopy (EIS), uniquely adapted to be in-line with ultra narrow band measurement, provides a comprehensive solution: monitoring both the real (conductivity) and imaginary (capacitance) components of a fluid's electrical impedance to precisely quantify coolant composition, detect corrosion-inhibitor film formation, and identify the earliest stages of biological fouling.
The Thermal and Resource Realities of Accelerated Computing
The Transition to Liquid Cooling
The transition toward accelerated computing, driven by advanced Graphic Processing Units (GPUs) and specialised tensor processing cores, has catalysed a thermal crisis in the data centre sector. A single modern AI-focused GPU, such as the NVIDIA H100 SXM, dissipates approximately 700 watts of thermal energy, with next-generation platforms approaching and exceeding 1,000 watts per device. When clustered into high-density server configurations, the resulting heat loads render traditional Computer Room Air Conditioning (CRAC) and Computer Room Air Handler (CRAH) systems functionally inadequate.
700 W
Per GPU thermal load (NVIDIA H100 SXM)
100–250 kW
Rack power density for AI workloads
30–40%
Facility power wasted on cooling in poorly optimised sites
Air cooling is inherently constrained by the low specific heat capacity and thermal conductivity of air. Traditional air-side infrastructure, including fans, coils, and ducting, can account for 30 to 40% of a facility's total power consumption in poorly optimised facilities, placing extreme pressure on overall PUE targets. To maintain processor junction temperatures within safe operating limits, operators are widely adopting liquid cooling mechanisms.
Direct-to-chip (D2C) cooling routes liquid coolants through microchannel cold plates affixed directly to processors, effectively removing 70–80% of the heat load at the source. For extreme power densities, single-phase and two-phase immersion cooling technologies submerge entire IT assets into tanks of engineered dielectric fluids, offering near-perfect thermal capture and driving PUE ratios toward values as low as 1.03–1.1.
The Escalating Crisis of Water Consumption
The shift to high-density compute does not merely challenge energy grids; it places an unprecedented strain on water supplies. Data centres consume water primarily through evaporative cooling towers. A mid-sized 15 MW data centre can consume between 300 and 500 million litres of water annually, comparable to the daily water needs of a town of up to 50,000 residents, placing these facilities among the largest industrial water users in many local catchments.
4.2–6.6 Bn m³
Projected global AI water demand by 2027
65%
UK data centre water consumption from just the top 6 operators
5 Bn litres/day
UK projected water deficit by 2050
Regulatory Pressures and Efficiency Benchmarks
In response to the environmental impact of digital infrastructure, regulatory bodies are implementing stringent transparency and efficiency mandates. The EU's Energy Efficiency Directive (EED) requires data centres with an installed IT power demand of at least 500 kW to publicly report key sustainability indicators, explicitly including WUE and PUE.
The Climate Neutral Data Centre Pact (CNDCP), a self-regulatory initiative supported by the European Commission, has established aggressive targets. By the end of 2040, existing data centres that replace their cooling systems must achieve a WUE target of 0.4 litres per kilowatt-hour (L/kWh). Achieving this requires operators to maximise their Cycles of Concentration (CoC); the number of times water can be recirculated before dissolved mineral concentrations mandate a discharge. Operating at high CoC drastically reduces freshwater withdrawal, but pushes the cooling fluid dangerously close to its chemical saturation limit, risking mineral scaling. Optimising this balance demands precise, real-time fluid monitoring.
The Chemistry and Thermodynamics of Glycol Coolants
While evaporative cooling towers reject heat to the atmosphere, the internal closed-loop systems that collect heat from server halls require specialised heat transfer fluids. In climates subjected to freezing temperatures, or in facilities utilising outdoor heat rejection equipment such as dry coolers, pure deionised (DI) water cannot be used due to the risk of freezing and pipe rupture. To mitigate this, operators rely on mixtures of water with either ethylene glycol (EG) or propylene glycol (PG).
Freezing Point Depression and Thermal Transfer
Glycol serves as a vital antifreeze agent. The molecular interaction between glycol and water disrupts the hydrogen bonding network of the water molecules, significantly lowering the mixture's freezing point. Typical data centre deployments use a 25% propylene glycol solution.
The addition of glycol introduces a thermodynamic penalty: compared to pure water, glycol has a lower specific heat capacity and a significantly higher dynamic viscosity. A glycol-water mixture is therefore less efficient at absorbing and transporting heat per unit volume, and it requires more pumping power to overcome increased frictional resistance. The exact concentration must be managed with precision: under-dosing risks freeze damage, while overdosing unnecessarily degrades the thermal transfer coefficient, forcing pumps to consume excess electricity.
Thermal Degradation and Acidification
The operational environment of an AI data centre is exceptionally harsh. The fluid circulating through direct-to-chip cold plates is subjected to intense, localised thermal stress, with processor junction temperatures frequently approaching or exceeding 70°C. EG and PG are not permanently stable under these conditions; prolonged exposure to elevated temperatures and dissolved oxygen causes the glycol molecules to undergo thermal and oxidative degradation.
This breakdown yields a variety of highly acidic by-products; most notably glycolic acid, formic acid, and acetic acid. As these organic acids accumulate in the closed loop, the pH of the coolant drops precipitously. This acidification transforms a benign heat transfer fluid into a highly corrosive electrolyte. In poorly managed systems, significant degradation can occur within mere months of commissioning a new cooling loop.
Galvanic Corrosion
Modern data centre cooling loops are complex assemblies comprising multiple dissimilar metals. A single loop may feature copper microchannel cold plates, aluminium distribution manifolds, carbon steel pipework, and brass valves. When these dissimilar metals are electrically connected and immersed in a conductive, acidic electrolyte, such as degraded glycol, a galvanic cell is inadvertently formed.
In this electrochemical reaction, the less noble (more anodic) metal preferentially dissolves into solution. In a system containing both copper and aluminium, the aluminium typically acts as the anode, corroding rapidly. The standard anodic oxidation reaction for iron, which is relevant in steel pipework, is:
Fe → Fe²⁺ + 2e⁻
The cathodic reduction reaction, occurring at the more noble metal surface, is the Oxygen Reduction Reaction (ORR):
O₂ + 2H₂O + 4e⁻ → 4OH⁻
As the localised pH drops due to glycol degradation, an additional aggressive cathodic reaction — the Hydrogen Evolution Reaction (HER) — becomes prominent:
2H⁺ + 2e⁻ → H₂
Corrosion weakens the metal walls of pipework and cold plates, eventually creating pinhole leaks. In high-density server racks, leakage of the now conductive coolant onto energised GPU motherboards represents a catastrophic failure event. Furthermore, circulating corrosion debris threatens to clog microchannel passages in cold plates, which can be as narrow as 50–200 microns, severely restricting flow and causing processors to thermally throttle.
Corrosion Inhibitors: Inorganic and Organic Acid Technologies
To mitigate the existential threat of acidification and galvanic corrosion, raw glycol is never used in industrial applications without chemical treatment. Commercial heat transfer fluids are heavily inhibited, fortified with complex chemical packages designed to passivate wetted metal surfaces. These corrosion inhibitors fall into two primary categories:
Inorganic inhibitors, such as nitrites, silicates, and phosphates (e.g., Trisodium Phosphate or TSP), are highly reactive compounds that chemically bond with the metal substrate to form a thick, rapid-acting passivation layer. However, they are rapidly depleted during the passivation process, requiring frequent monitoring and aggressive chemical redosing. The discharge of heavy inorganic salts also poses environmental risks.
Organic Acid Technology (OAT) inhibitors, such as carboxylates and benzoates, operate via a more sophisticated equilibrium mechanism and have become the industry standard for long-life data centre coolants. OAT inhibitors are added in deliberate excess, establishing a dynamic thermodynamic equilibrium between inhibitor molecules dissolved in the bulk fluid and those adsorbed onto the metal surface as a monomolecular protective film. This microscopic film physically blocks dissolved oxygen and acidic ions from interacting with bare metal.
Crucially, because OAT inhibitors are typically formulated as conjugate base salts, they also provide chemical buffering, neutralising acidic degradation products and stabilising pH over a lifespan of up to 8–10 years. However, this protection depends entirely on maintaining the inhibitor concentration above a critical threshold. System leaks, improper make-up water additions, or overwhelming thermal degradation can deplete the inhibitor package, leaving the system acutely vulnerable.
The Inadequacies of Legacy Monitoring Systems
Despite the mission-critical nature of coolant chemistry, the data centre industry has historically relied on inadequate, lagging indicators to monitor the health of these complex electrochemical systems.
Grab Sampling
The standard operational procedure involves periodic 'grab sampling', wherein a maintenance technician physically extracts a coolant sample and dispatches it to an off-site laboratory for analysis (e.g., per ASTM D1384). While this provides a comprehensive chemical breakdown, it introduces a massive temporal gap, often weeks or months, between the onset of a destructive chemical process and its eventual detection.
The Cost of Delay
During the weeks awaiting test results, an undetected pH drop can initiate severe pitting corrosion in copper cold plates. By the time the facility manager receives the report indicating inhibitor depletion, irreversible mechanical damage may already have occurred; transitioning the system from preventative maintenance to emergency remediation.
Basic Conductivity Sensors
In-line monitoring attempts have traditionally been limited to rudimentary two-electrode electrical conductivity (EC) sensors. While a sudden spike in conductivity indicates that the fluid's chemical composition has changed, simple EC probes lack diagnostic depth. A basic conductivity reading cannot differentiate between the benign concentration of minerals due to normal cooling tower evaporation, the deliberate addition of protective chemical salts, or the critical accumulation of corrosive iron and copper ions.
Furthermore, standard conductivity sensors are highly susceptible to interference from entrained air. In active pumping systems, microscopic air bubbles flow past the electrodes, creating severe erratic drops in the conductivity data. Because these sensors cannot distinguish between a genuine change in fluid chemistry and the passage of an air void, their data becomes inherently noisy; undermining the reliability required for automated dosing systems.
Manual Refractometry
Operators frequently monitor bulk glycol concentration using manual handheld refractometers, which estimate the percentage of glycol from the refractive index of the fluid. This manual, localised process cannot continuously detect sudden dilution events across vast, distributed hyperscale facilities. An automated make-up valve slowly admitting untreated municipal water into the closed loop can quietly dilute the glycol over several months, dropping the concentration below the threshold for both freeze protection and inhibitor efficacy, before the next scheduled check.
The Technological Shift: Monochromatic Electrical Impedance Sensing
Redefining Impedance Spectroscopy
Traditional EIS is an offline, time-intensive laboratory technique used to evaluate the complex electrochemical properties of an electrode-electrolyte interface. The conventional process scans a fluid sample across a wide frequency spectrum and plots the complex impedance as a Nyquist or Bode diagram to deduce properties of the fluid and electrode surface. This methodology is highly sensitive to parasitic electrical noise and requires minutes or even hours to complete a single scan; making it entirely unsuitable for real-time industrial process control.
4T2 Sensors has revolutionised this approach by developing a patented, ultra-narrowband measurement technique that operates monochromatically at significantly higher frequencies than are typically seen in traditional EIS. Measuring at these elevated frequencies ensures that the bulk properties of the fluid completely dominate any localised electrode polarisation effects.
This high-frequency, monochromatic approach enables continuous, real-time, in-line measurement of the fluid stream directly within the data centre cooling loop. Crucially, the frequency can be altered to permit the measurement of surface phenomena, such as the formation of inhibitor films and biological films.
Sensor Architecture and Sanitary Design
The physical sensor cell is engineered to withstand the rigorous demands of industrial coolants. The design features a coaxial, cylindrical structure comprising an outer pipe and an inner rod, both constructed from 316 stainless steel. The coaxial geometry was deliberately chosen so that the outer pipe functions naturally as an electromagnetic compatibility (EMC) shield, protecting the delicate internal measurements from the intense electrical noise generated by server racks and variable frequency drives (VFDs).
The stainless steel electrodes are electrically isolated using specialised PEEK (polyether ether ketone) end caps, uniquely designed to extend beyond the active measuring region, capturing stray electric fields.
The sensor is designed for direct in-line installation with full flow-through, ensuring the entire volume of fluid is measured continuously, unlike traditional probe sensors that only sample a localised fraction of the flow.
Digital Signal Processing and Superresolution
An alternating signal generator applies a sinusoidal drive signal at the desired high frequency across the sensor electrodes. A microprocessor receives the resulting sense signal from the fluid and calculates the complex difference between the drive and sense waveforms. This yields two distinct, highly valuable measurements simultaneously:
The In-Phase (Real) Component: This isolates the electrical conductivity of the fluid; directly proportional to the concentration of dissolved ions, salts, and acidic degradation products.
The Quadrature (Imaginary) Component: This isolates the capacitance of the fluid, which is directly proportional to the relative permittivity (dielectric constant) of the medium; providing a measurement of the fluid's composition and its ability to store charge.
Because the phase shifts in aqueous industrial solutions are incredibly minor, extracting meaningful data requires extreme precision. The 4T2 microprocessor utilises highly optimised phase-tracking and ultra-low bandwidth algorithms to achieve 'superresolution': measurement resolution that far exceeds the native limits of standard analogue-to-digital converters (ADCs).
0.02 mS/m
Conductivity resolution
0.1 ppm
Equivalent electrolyte detection limit in pure water
>10×
More accurate than standard industrial temperature compensation
Multivariable Temperature Compensation
Both the conductivity and capacitance of an aqueous solution are highly dependent on temperature. As fluid temperature rises, the kinetic energy of the molecules increases and the fluid viscosity decreases, which significantly boosts ionic mobility and artificially inflates conductivity readings. To draw accurate conclusions about chemical changes, all raw measurements must be compensated back to a standard reference temperature, typically 20°C.
The sensor cell incorporates two thin-walled Negative Temperature Coefficient (NTC) thermistors at each end, providing a highly accurate estimate of the fluid's true average temperature across the entire cell volume. The raw resistance data is fitted to the Steinhart-Hart equation, a complex polynomial algorithm providing temperature resolution of ±3 mK, with an overall measurement error of less than 0.02°C across a 100°C range.
Standard industrial sensors attempt to compensate for temperature using rudimentary linear alpha or beta models that assume the temperature coefficient is a simple constant of approximately 2% per °C. While acceptable for highly concentrated solutions over very narrow temperature bands, these models fail across the wide temperature gradients seen in modern cooling loops, exhibiting maximum errors of up to 10%. In contrast, 4T2's advanced DSP algorithms utilise a proprietary multivariable model expressed more than 10 times more accurately than standard industry methods.
Overcoming Entrained Air: Bubble Compensation
As pumps circulate coolant through complex piping geometries, microscopic air bubbles inevitably become trapped in the flow. Traditional conductivity sensors are blind to these bubbles; when a non-conductive air void passes over the electrode, the sensor registers a severe erratic drop in conductivity.
The simultaneous measurement of electrical capacitance provides an elegant solution. The relative permittivity of different materials varies dramatically, water has a relative permittivity of approximately 80, while air has a value of just 1. Because the presence of air bubbles significantly impacts the overall capacitance of the fluid volume, the DSP algorithm continuously compares the real-time measured capacitance against a calibrated baseline. By quantifying the difference, the algorithm accurately calculates the exact void fraction within the sensor cell and feeds this back into the conductivity calculation, mathematically removing bubble-induced noise.
This proprietary 'Bubble Compensation' technique guarantees a stable, noise-free conductivity measurement regardless of flow turbulence or aeration, enabling highly reliable automated process control.
Three Proven Sensor Capabilities: Experimental Validation
To definitively validate the efficacy of monochromatic EIS for the specific challenges of data centre cooling, rigorous experimental protocols were executed across three distinct domains, each representing a real operational risk. The testing demonstrated the sensor's ability to precisely characterise bulk fluid composition, detect the microscopic formation of corrosion inhibitor films, and respond to the presence of biological fouling on electrode surfaces.
Glycol:Water Composition Monitoring
Operators must ensure the glycol-to-water ratio remains within strict tolerances to guarantee freeze protection and bacterial growth prevention. This experiment demonstrated that measuring the bulk dielectric constant via capacitance accurately maps dilution events in real time, far faster and with greater accuracy than manual refractometer checks.
Experimental Setup
An initial baseline solution of 1 L, comprising a precise 30% mixture of ethylene glycol in Reverse Osmosis (RO) water, was established. To simulate gradual dilution, akin to a weeping make-up water valve, RO water was added incrementally to adjust the composition in precise increments. The absolute volume of glycol was held constant at 300 mL while the volume of RO water was systematically increased. The fluid was allowed to mix and stabilise for 7–9 minutes between each dilution step to ensure complete homogenisation prior to recording the sensor reading.
Table 2: A Subsection of The Volumetric Dilution Schedule for Ethylene Glycol Testing
Glycol Volume (mL) | RO Water Volume (mL) | Resulting Concentration (%) |
|---|---|---|
300 | 891.4 | 25.18 |
300 | 894.3 | 25.12 |
300 | 897.1 | 25.06 |
300 | 900 | 25 |
300 | 902.9 | 24.94 |
Results and Analysis
The high-frequency sensor variant (HF 1322) was used to measure the change in the delta signal (capacitance expressed in picofarads, pF). The results demonstrated a highly reliable, largely linear relationship between the glycol concentration and the median delta signal, perfectly correlating with the constant dilution factor. The signal shifted predictably from approximately −16 pF at 20% concentration to approximately −23 pF at 28%.
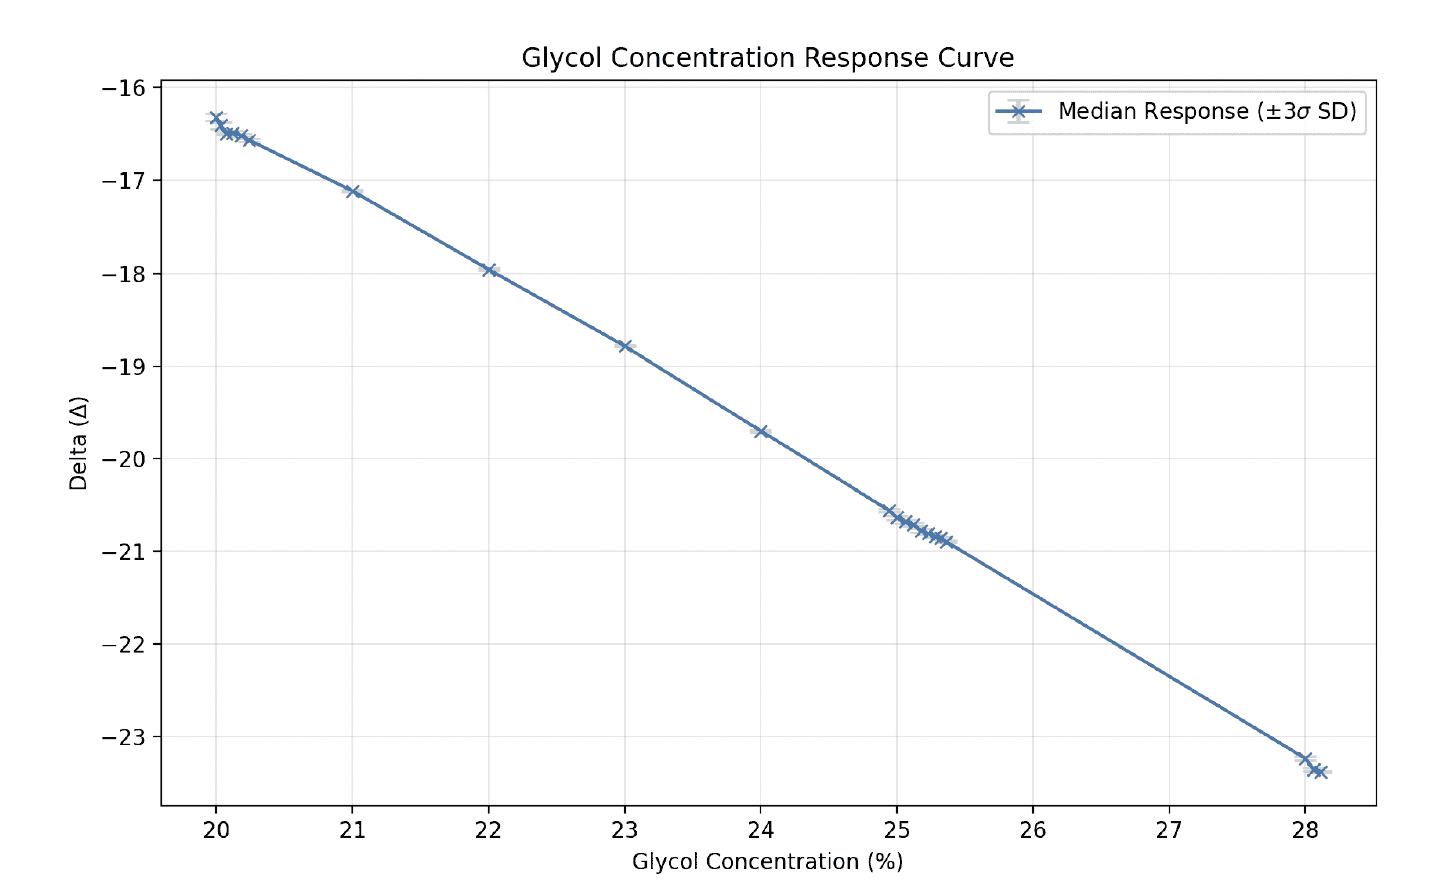
Figure 1 — Sensor HF 1322: Delta capacitance signal (pF) vs. glycol concentration (%). The highly linear response and negligible error bars confirm exceptional measurement resolution.
Crucially, the sensor maintains an exceptionally high signal-to-noise ratio (SNR). Even when applying a rigorous 3σ(three-sigma) statistical standard, representing a 99.7% confidence interval, the instrumental noise floor remains negligible.
To elucidate the true resolution of the sensor, precise volumes of RO water (0.5mL) were titrated into the glycol-water mixture. These additions were quantified using the weighing-by-difference method. This gravimetric approach minimized the uncertainties inherent in small-scale volumetric measurements, ensuring the determined sensor resolution remained highly accurate and reproducible.
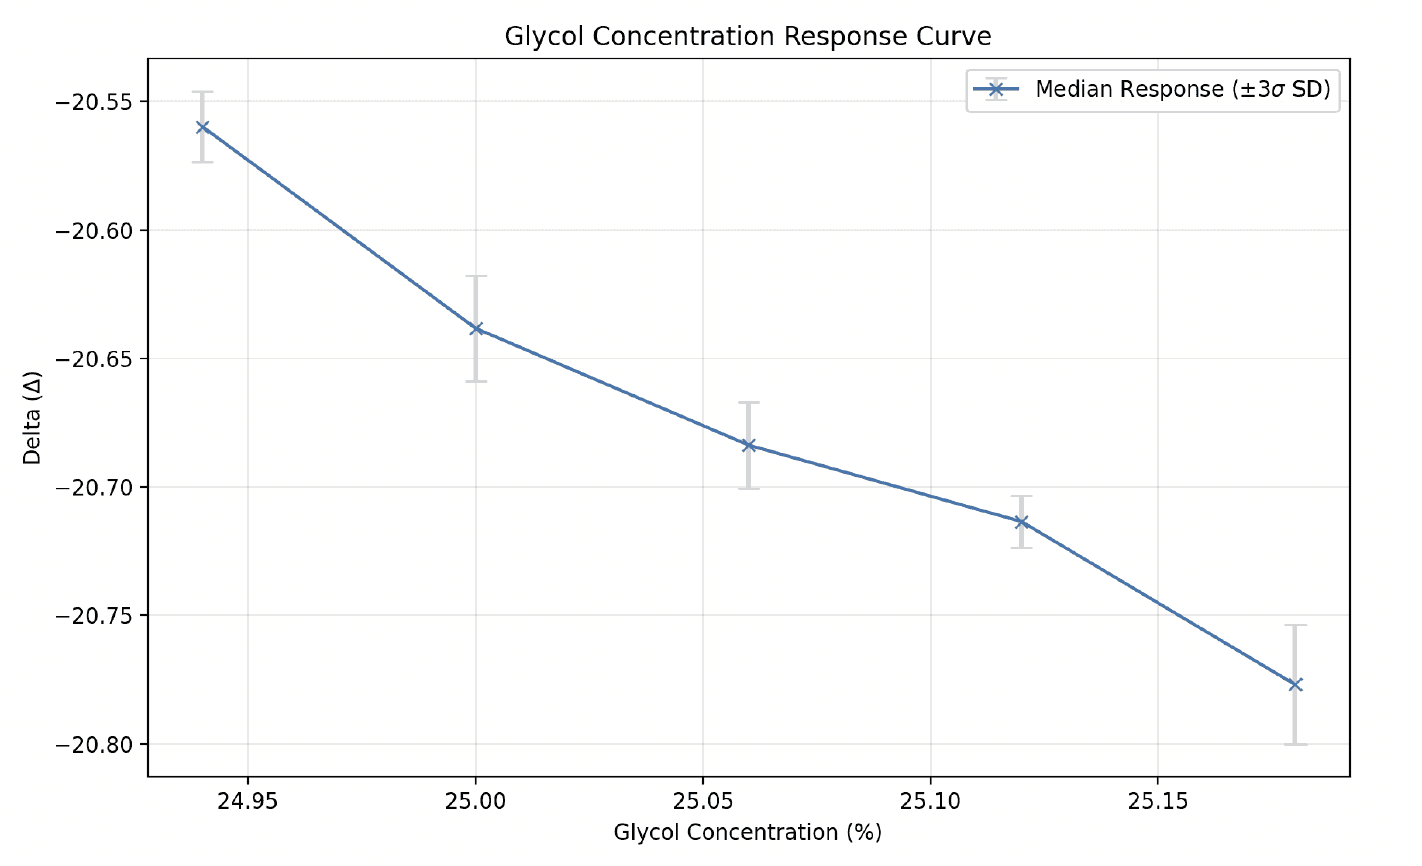
Figure 2 — Sensor HF 1322: Delta capacitance signal (pF) vs. glycol concentration (%). The subsection of the plot shown in Figure 1 highlights the lack of error bar overlap, proving 0.06% resolution is attainable.
Each data point represents a discrete 0.06% concentration step, and all have error bars set to a 3σ standard. As there is no overlap of error bars across this range, it was concluded, to a 99.7% confidence level, that the sensor has a resolution of 0.06%. This performance was replicated across a broad operational envelope, including 20%, 28%, and 60% glycol concentrations, with identical resolution limits observed at every checkpoint. This exceptional resolution means the sensor can instantly detect minute shifts in coolant composition, immediately triggering intervention if a leak, ingress or improper top-up occurs.
Key Finding
The sensor detected each 0.06% incremental dilution step with negligible noise, across a concentration range from 20% to 60% ethylene glycol. The linear, highly resolved response makes this a reliable replacement for periodic manual refractometry.
Detection of Organic Acid Corrosion Inhibitor Films
The second phase of validation tested the sensor's capability to detect the critical adsorption of organic acid inhibitors onto wetted metal surfaces. Sodium Benzoate (NaBz), the sodium salt of benzoic acid, was selected as an appropriate chemical proxy for the carboxylate-based OAT inhibitors predominantly used in high-end data centre coolants. Typical industrial target concentrations for such inhibitors range broadly from 100 to 10,000 ppm, depending on the application.
Experimental Setup
A concentrated stock solution was prepared by dissolving 1.06 g of NaBz in 50 mL of RO water. The test environment consisted of a 50% ethylene glycol solution. The stock solution was injected into the test cell in 5 mL doses, each calculated to elevate the bulk fluid concentration by exactly 100 ppm.
To rigorously ensure that detection claims were genuine, a strict Limit of Detection (LOD) threshold was established at 3 times the standard deviation (3σ) of the inherent background noise of the pure, uninhibited baseline solution (0 ppm). Any shift in the median delta capacitance below this magnitude was strictly categorised as 'undetectable'. At 25°C, the 3σ LOD threshold was 1.15 pF.
Results at 25°C
Between 0 ppm and 300 ppm, changes in the electrical signature remained within the bounds of baseline noise. However, precisely at the 400 ppm mark, the delta signal definitively breached the 3σ LOD threshold. This statistically significant shift in capacitance represents the exact electrochemical inflection point where Sodium Benzoate molecules begin to tightly adsorb onto the stainless steel electrodes, establishing the monomolecular protective film necessary for corrosion prevention.
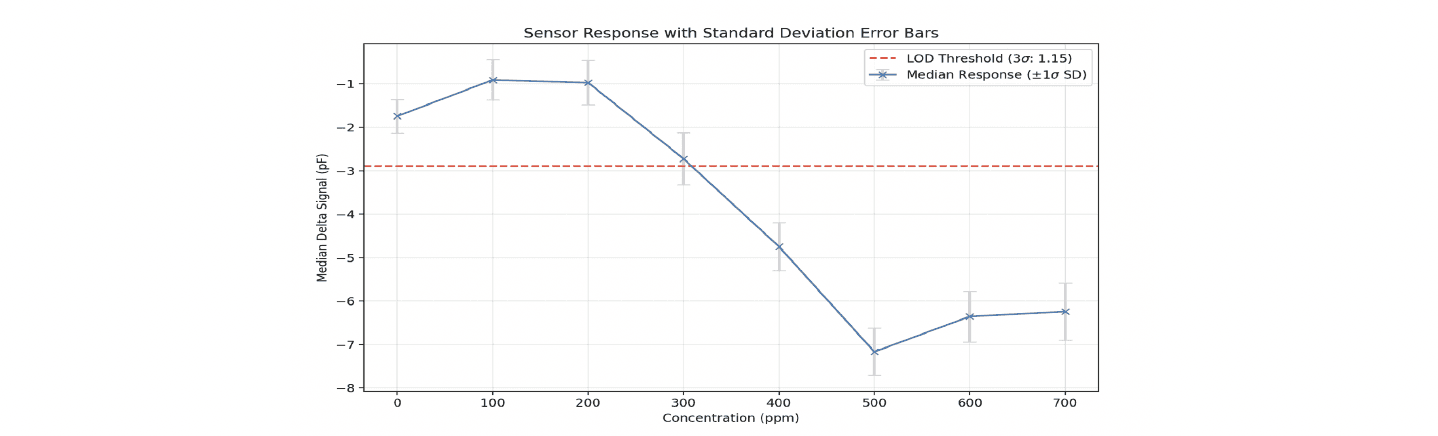
Figure 3 — NaBz film formation at 25°C. The dashed red line indicates the 3σ LOD threshold (1.15 pF). Film formation is first detected at 400 ppm.
Results at 50°C — Thermal Enhancement of Film Kinetics
Because data centre cold plates operate at elevated temperatures, the experiment was repeated at 50°C using the low-frequency sensor variant (LF 3011) to evaluate the impact of thermal energy on film kinetics. At this temperature, the LOD threshold shifted slightly to 1.89 pF. However, the critical point of detection — the definitive formation of the inhibitor film — occurred at a noticeably lower concentration than at 25°C.
This result validates fundamental electrochemical theory: the increased thermal energy provides the kinetic energy for the large organic benzoate anions to more rapidly overcome the activation energy barrier of adsorption. The thermally energised molecules re-organise and pack tightly against the metal lattice faster, establishing robust corrosion protection at lower bulk concentrations when the system is under thermal load.
Figure 3 — NaBz film formation at 50°C (LF 3011, 3σ LOD: 1.89 pF). Compared with 25°C, film formation is detected at a lower inhibitor concentration, consistent with thermally enhanced adsorption kinetics.
Inorganic Inhibitor Dynamics: Trisodium Phosphate
To confirm the technology's versatility across different inhibitor chemistries, testing was also conducted using Trisodium Phosphate (TSP, Na₃PO₄), a common inorganic corrosion inhibitor known to bind aggressively to metallic substrates. Unlike OAT inhibitors that establish a dissolved-surface equilibrium, phosphates chemically react and bond with the metal surface with high affinity, forming a denser passivation layer at lower bulk concentrations.
Results
Using the LF 3011 sensor (3σ LOD: 2.15 pF), a definitive, precipitous drop in delta capacitance was recorded at the 50 ppm mark — significantly below the threshold required for OAT detection. Between 60 ppm and 100 ppm, the signal plateaued, indicating the stable completion of the primary monolayer across the electrode surface. An additional secondary drop in capacitance was recorded at 200 ppm, consistent with bi-layer film coverage or structural reorganisation of the passivated layer.
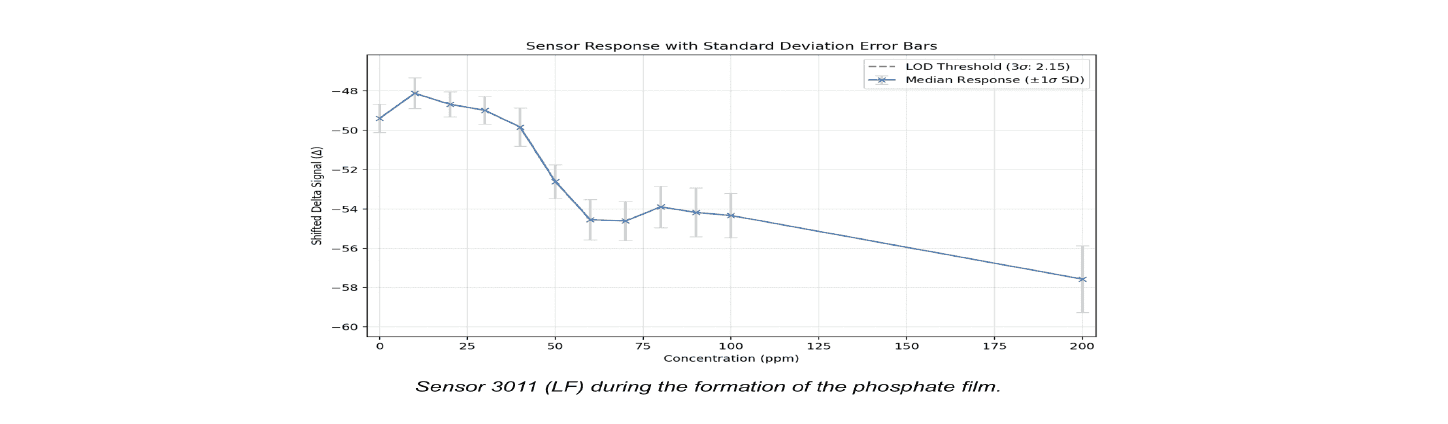
Figure 4 — TSP (phosphate) film formation (LF 3011, 3σ LOD: 2.15 pF). Clear film formation is detected at 50 ppm, well below the OAT detection threshold.
400 ppm
OAT inhibitor film detected (NaBz, 25°C)
50 ppm
Inorganic inhibitor film detected (TSP/phosphate)
< 50°C
Threshold reduced at elevated temperature — consistent with real cooling loop conditions
Film Persistence Verification
To assess whether the capacitance shifts reflected a persistent physical film on the electrode surface — rather than merely bulk fluid conductivity changes — the phosphate-laden fluid was drained from the test cell. The sensors were rinsed with a pure glycol solution to flush away unbound, free-floating phosphate ions, and the cell was refilled with fresh, uninhibited 50% glycol.
Upon testing the fresh fluid, both sensors did not return to their original 0 ppm baseline state; a persistent delta of approximately −54 pF was maintained. While this is strongly consistent with the continued presence of a bound phosphate film on the electrodes, it is important to note an experimental caveat: the two glycol solutions (used before and after film formation) were prepared independently, introducing inherent variability between analyte batches. A more controlled follow-up test — in which multiple rinse volumes of the same batch glycol are measured sequentially — is recommended to definitively isolate the film contribution from batch-to-batch composition variance.
Biofilm Detection: The Third Sensing Dimension
Biofouling is a significant and often underestimated operational risk in data centre cooling loops. Bacteria and other microorganisms can colonise the interior surfaces of cooling pipework, particularly in open-circuit evaporative cooling towers where the water is regularly exposed to the atmosphere. Once attached, these organisms excrete extracellular polymeric substances (EPS) — a complex biological matrix of proteins, polysaccharides, and nucleic acids — that anchors the colony and progressively coats the metal surface. This biological film reduces heat transfer efficiency, promotes under-deposit corrosion, and can survive far higher concentrations of biocides than free-floating organisms.
The Electrochemical Signature of Biofilm Growth
The impedance sensor detects biofilm presence through its effect on the electrical double-layer capacitance (DLC) at the electrode-electrolyte interface. At low measurement frequencies, ions in the fluid are free to migrate and accumulate at the electrode surface, forming a capacitive double layer that the sensor measures directly. When a biofilm is present, two mechanisms reduce this double-layer capacitance:
EPS adsorption: Extracellular polymeric substances secreted by the biofilm adsorb onto the electrode surface, physically occupying the electrode-electrolyte boundary and reducing the effective electrode area available for double-layer formation.
Increased Helmholtz layer distance: The EPS matrix and attached biological material increase the effective separation distance between the electrode surface and the first layer of counter-ions — reducing capacitance in accordance with the Helmholtz model: C = ε₀εᵣA/d.
Critically, this effect is detected specifically at low measurement frequencies, while high-frequency readings — which measure bulk fluid properties — remain unaffected by the surface biofilm. This frequency-dependent response is precisely what allows the sensor to differentiate between a biological surface event and a bulk chemistry change: the sensor's multi-frequency architecture provides the diagnostic resolution that a simple conductivity probe simply cannot achieve.
Experimental Validation
Experimental validation was conducted using Saccharomyces cerevisiae (brewer's yeast) as a model biofilm-forming organism, appropriate for validating the sensor's response to biological fouling. Electrodes were exposed to a previously incubated yeast solution (YPD broth medium) for varied periods — ranging from 4 to 11 days — to promote biofilms of different thickness and maturity. Electrodes were electropolished and passivated prior to each test to ensure a controlled, reproducible starting surface condition.
The polarisation capacitance was measured before and after yeast exposure across a range of fluid conductivities (achieved by stepwise addition of MgSO₄ to the working fluid). This allowed the experiment to isolate the surface effect of the biofilm from any bulk fluid changes.
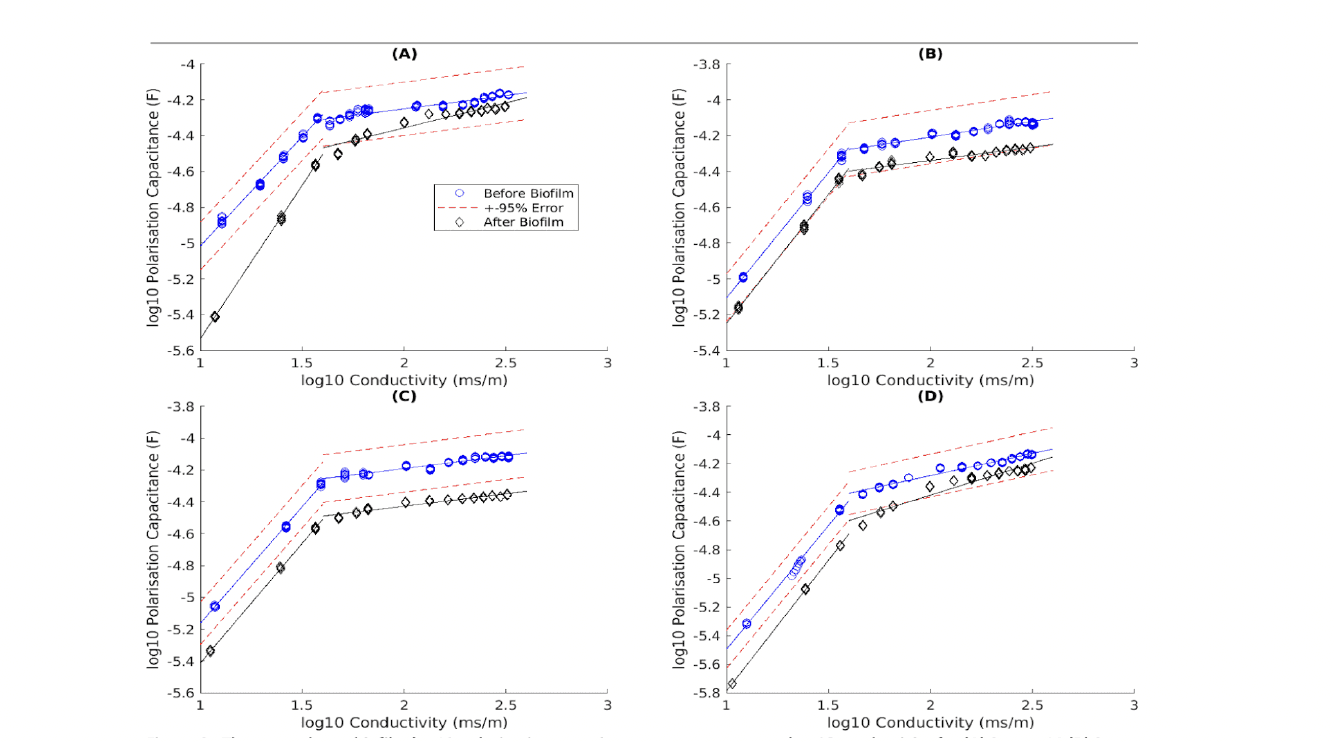
Figure 5 — Pre- vs. post-biofilm polarisation capacitance (log₁₀ scale) vs. fluid conductivity for multiple sensor electrodes (Sensors 11–15). The consistent downward shift after yeast exposure confirms biofilm-induced reduction in double-layer capacitance.
The data demonstrates a clear, consistent decrease in polarisation capacitance following exposure to the yeast solution across all tested electrodes. The parallel shift of the post-biofilm curve — particularly evident in Sensor 13 — indicates that the primary change is in the surface condition fitting parameter (A in the Scheider model Cp = A × [g]^α), with the slope parameter α remaining largely stable. This behaviour is precisely consistent with EPS reducing the effective electrode surface area, as expected from the Helmholtz model.
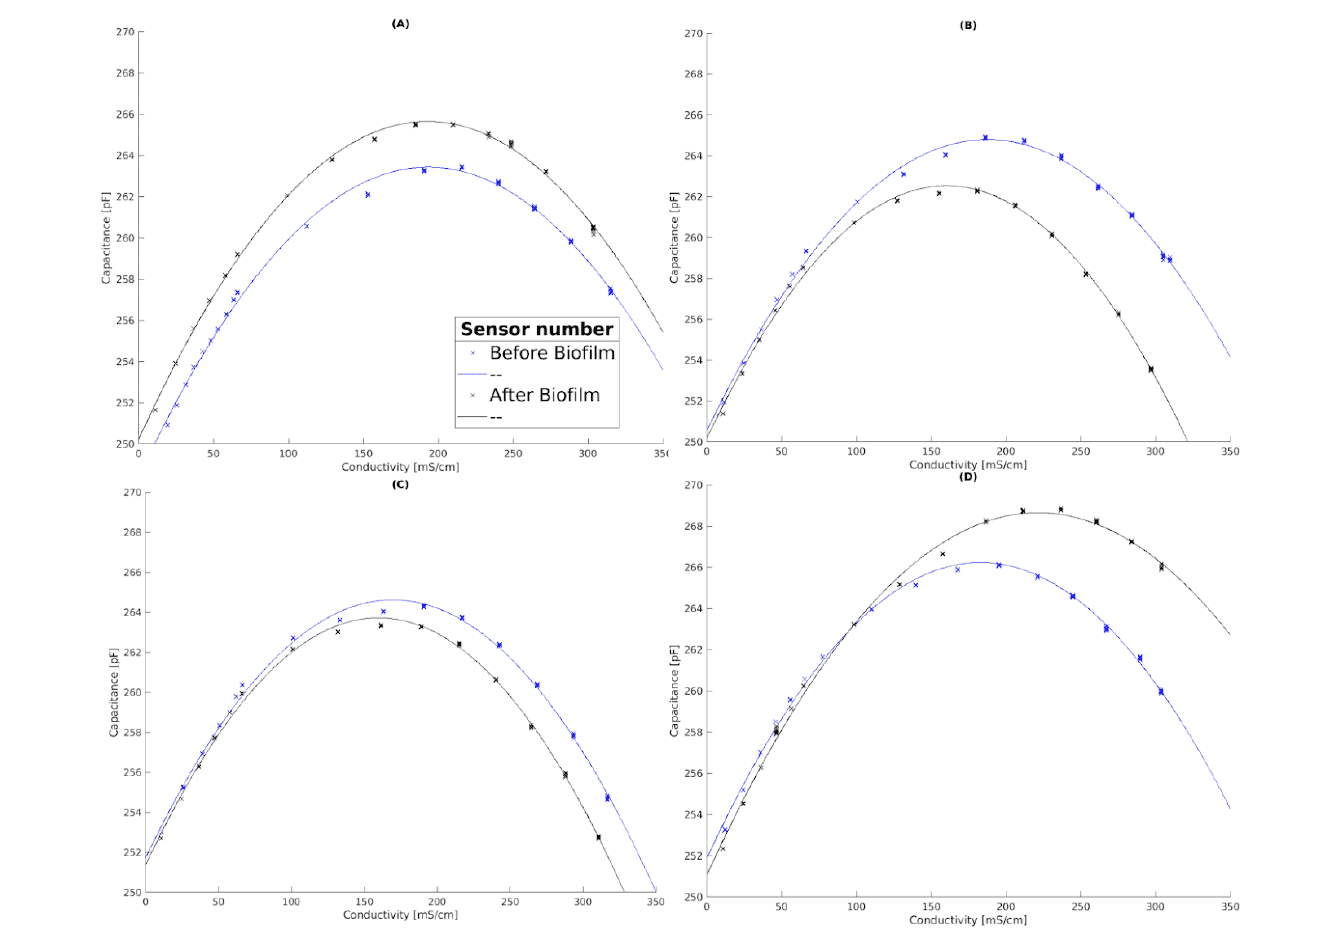
Figure 6 — High-frequency (bulk) capacitance measurements before and after biofilm growth across the same sensors. The near-identical pre- and post-biofilm curves confirm that the biofilm has no significant effect on bulk fluid properties — the low-frequency surface response is the sole diagnostic indicator.
Importantly, the high-frequency (bulk) measurements shown above exhibited no significant change following biofilm formation. This is not a limitation — it is the key diagnostic insight. The sensor's ability to resolve a surface-specific change at low frequency, while confirming bulk fluid properties are unaffected at high frequency, gives operators confident attribution: a capacitance anomaly at low frequency while bulk conductivity remains stable is a definitive signal of biofouling, not bulk chemistry change.
The effect of yeast incubation period on biofilm maturity was also explored. Electrodes exposed to a more mature (two-week) yeast culture showed greater and more consistent reductions in polarisation capacitance compared to those exposed to a 48-hour culture, where effects were smaller and less uniform. This is consistent with the understanding that EPS excretion — the primary mechanism of the capacitance shift — increases with biofilm maturation. Early-stage biofilms have not yet fully colonised the electrode surface and produce less EPS, while mature biofilms with established EPS matrices show a more pronounced electrochemical signature.
Operational Significance
The ability to detect biofilm at the electrode surface — before significant EPS matrix development and under-deposit corrosion begin — allows operators to deploy targeted biocidal treatments proactively. This avoids the costly cycle of full system flush and recharge that is often the only remedy once mature biofilm colonies are entrenched in microchannel cold plates.
Translating Technical Efficacy into Commercial ROI
The transition to condition-based, in-line EIS monitoring provides data centre operators with a highly compelling return on investment, driven by risk mitigation, asset longevity, and substantial resource conservation.
Eradicating the Cost of Unplanned Downtime
The most significant economic driver for implementing advanced fluid intelligence is the prevention of unplanned thermal outages. When aggressive glycolic acids degrade cold plates, the resulting pinhole leaks can destroy densely packed, multi-million-pound GPU arrays.
$9,000/min
Average cost of data centre downtime
$540,000/hr
Equivalent hourly cost
$6.5M/hr
Cost in finance and brokerage sectors
Industry statistics indicate that 1 in 5 operators report their most recent severe outage cost over $1 million. Post-incident analysis consistently reveals that the cost of repairing the physical equipment is negligible compared to the downstream costs of lost revenue, breached Service Level Agreements (SLAs), and reputational damage. By tracking the real-time health of the corrosion inhibitor film via impedance spectroscopy, operators eliminate the dangerous 'blind spots' between manual grab samples, allowing for precise, predictive intervention before electrochemical pitting ever initiates.
Extending Coolant Lifespan and Reducing OpEx
Hyperscale liquid cooling architectures hold massive volumes of engineered heat transfer fluids. Completely draining, flushing, and replacing the coolant in a standard 10 MW direct-to-chip facility is a major capital and operational event.
$15–25K
Quality inhibited glycol for a 3,000–5,000 gallon deployment
$25–40K
Total replacement cost including labour and downtime
8–10 yrs
Extended coolant lifespan achievable with real-time inhibitor monitoring
Without empirical, continuous data on fluid health, operators frequently execute premature, schedule-based replacements simply to avoid risk. Impedance fingerprinting allows operators to confidently run coolants right up to their actual chemical end-of-life. Furthermore, by integrating sensor data into DCIM, operators can automate the precise dosing of supplementary inhibitor packages, re-passivating the system dynamically and extending the overall lifespan of the base glycol by several years.
Operational Analogies: The CIP Efficiency Case Study
The profound impact of transitioning from scheduled maintenance to data-driven operational control has been definitively proven in analogous fluid-processing environments. In a recent two-month field trial at a major soft drinks manufacturer, 4T2 Sensors installed an impedance sensor on the return line of a Clean-In-Place (CIP) system to monitor cleaning efficiency in real time.
The facility utilised traditional time-based CIP recipes, assuming these safety margins were necessary for regulatory compliance. However, algorithmic analysis of 43 CIP cycles revealed massive Schedule Overruns. A hot wash designed to run for 15 minutes at 85°C consistently ran for 27 minutes — a 12-minute overrun per cycle. The facility was spending 4.4% of its total process time on cleaning, exactly double the required 2.2%.
120 hrs
Annual opportunity hours saved per line from CIP optimisation
1,200 m³
Treated water saved annually
4.2 t CO₂
Annual CO₂ equivalent reduction
This same paradigm shift — from over-specified, schedule-based waste to precise, data-driven optimisation — applies directly to the management of data centre cooling loops, promising proportional savings in energy and chemical usage.
Regulatory Compliance and Environmental Stewardship
As the data centre industry faces mounting pressure from environmental agencies and local municipalities, the ability to empirically prove sustainable water and chemical management is becoming a prerequisite for continued operation and expansion.
Optimising Water Usage Effectiveness (WUE)
To meet the EU's EED reporting mandates and achieve the CNDCP's target of 0.4 L/kWh by 2040, operators utilising evaporative cooling towers must aggressively optimise their Cycles of Concentration (CoC). The continuous, high-resolution detection of microscopic mineral scaling via EIS allows operators to run their systems at higher CoC with absolute confidence. Rather than adhering to conservative, schedule-based blowdowns that prematurely discharge millions of litres of highly treated water into municipal sewers, the intelligent system only triggers a discharge when the sensor detects the definitive electrochemical onset of scale formation.
Mitigating Chemical Discharge
Extending the lifespan of glycol coolants and optimising the dosing of inhibitors and biocides drastically reduces the volume of toxic chemicals discharged into the environment. Traditional closed-loop systems often utilise high concentrations of nitrite inhibitors or heavy metals such as copper and zinc, which are toxic to aquatic life and heavily regulated. Unplanned drain-downs or excessive blowdowns can send tonnes of these regulated chemicals into local treatment plants, triggering severe fines and reputational damage. Predictive chemical management ensures that facilities maintain perfect operational protection while minimising their chemical footprint and ensuring strict compliance with local discharge caps.
Conclusion
The era of relying on visual inspections, delayed laboratory analyses, and rudimentary conductivity probes for mission-critical thermal management has effectively ended. The exponential heat loads generated by modern AI and HPC infrastructure mandate a permanent transition to highly complex, liquid-cooled architectures. This transition inherently necessitates granular, real-time control over the chemical and electrochemical stability of the coolant loop to prevent catastrophic hardware failures and optimise operational efficiency.
This white paper has presented experimental evidence for three core sensing capabilities, each proven under controlled laboratory conditions:
Glycol:Water Composition Monitoring: A linear, noise-free capacitance response to incremental dilution from 50% to 20% ethylene glycol, with negligible standard deviation — enabling instant, automated detection of dilution events that would take manual refractometry weeks to identify.
Corrosion Inhibitor Film Detection: Confirmed detection of organic acid (OAT) film formation at 400 ppm at 25°C, with the detection threshold reducing at operationally relevant elevated temperatures (50°C). Inorganic phosphate films detected definitively at 50 ppm — providing a real-time window into the passivation state of the cooling circuit.
Biofilm Detection: A measurable, statistically significant reduction in low-frequency polarisation capacitance following yeast biofilm formation on stainless steel electrodes, attributable to EPS-mediated modification of the electrode-electrolyte boundary. High-frequency (bulk) measurements remain unaffected, providing a frequency-selective diagnostic fingerprint that uniquely identifies biological fouling.
Together, these three capabilities represent a comprehensive fluid intelligence platform. By harnessing high-frequency, monochromatic electrical signals, multivariable temperature algorithms, and digital superresolution, 4T2's technology successfully translates laboratory-grade electrochemical analysis into a continuous, in-line operational tool.
By shifting from reactive schedules and blind assumptions to predictive, condition-based maintenance, operators can decisively mitigate the risk of multimillion-pound thermal outages, maximise the lifecycle of expensive engineered fluids, drastically reduce their environmental water footprint, and detect biological fouling before it escalates to a system-wide problem. In a regulatory and economic landscape increasingly defined by resource constraints, sustainability mandates, and uncompromising uptime demands, intelligent fluid monitoring is no longer an optional upgrade — it is a foundational requirement for the resilient digital infrastructure of the future.
Next-Generation Fluid Intelligence for Data Centre Cooling Infrastructure
Advanced Electrical Impedance Sensing for Real-Time Coolant Monitoring, Corrosion Prevention, and Sustainability Compliance
Executive Summary
The rapid escalation of AI rack power densities to 100–250 kW has made the transition from air to liquid cooling mandatory. However, this shift introduces "blind" risks: fluid degradation, corrosion, and biofouling that legacy monitoring — such as manual refractometry, grab sampling and conductivity — is too slow to detect. With downtime costs averaging $9,000 per minute, reactive maintenance is no longer viable.
4T2 Sensors address this gap through advanced monochromatic Electrical Impedance sensing. By measuring both the real (conductivity) and imaginary (capacitance) components of a fluid's electrical impedance simultaneously, the technology delivers a level of diagnostic depth that no legacy sensor can match. Three core capabilities have been experimentally validated:
① Glycol:Water Composition
Continuous, high-resolution detection of dilution events; far faster and more accurate than manual refractometry.
② Corrosion Inhibitor Film Presence
Detection of organic acid (OAT) film formation at concentrations as low as 400 ppm and inorganic phosphate films at 50 ppm.
③ Biofilm Detection
Measurement of the double-layer capacitance shift caused by EPS-secreting biofilms on electrode surfaces, enabling early fouling alerts.
The result is a platform capable of flagging coolant degradation, inhibitor depletion, and biological fouling in real time; long before conventional monitoring detects a problem. In an industry where a single hour of unplanned downtime can cost over $6.5 million, continuous fluid intelligence is no longer optional.
Additionally this platform enables a move to condition-based maintenance, extending coolant lifespans to 8–10 years and providing the empirical data necessary to meet strict WUE and EED regulatory mandates.
Introduction
The rapid growth of artificial intelligence (AI), machine learning, and high-performance computing (HPC) has fundamentally altered the thermal profile of modern digital infrastructure. As rack power densities escalate from historical enterprise averages of 5–15 kW to upward of 100–250 kW for AI workloads, traditional air-cooling methodologies have reached their physical, thermodynamic, and economic limits. In response, the data centre industry has aggressively pivoted toward liquid cooling architectures, including direct-to-chip (D2C) cold plates and immersive cooling systems, which offer vastly superior thermal transfer capabilities.
However, the integration of liquid cooling introduces significant operational vulnerabilities related to fluid degradation, corrosion and biofouling within the cooling loops. Simultaneously, the sheer volume of water and chemical coolants required to sustain hyperscale facilities has triggered intense regulatory and societal scrutiny. Global AI water demand is projected to reach between 4.2 and 6.6 billion cubic metres annually by 2027; an amount equivalent to four to six times Denmark's total annual water withdrawal. In the United Kingdom alone, government reports warn of a structural daily water deficit of nearly 5 billion litres by 2050. Regulatory frameworks such as the EU's Energy Efficiency Directive (EED) and the Climate Neutral Data Centre Pact (CNDCP) now mandate strict reporting on Water Usage Effectiveness (WUE) and Power Usage Effectiveness (PUE).
To navigate these compounding thermal, chemical, and regulatory pressures, data centre operators must transition from reactive, schedule-based maintenance to predictive, continuous fluid monitoring. Advanced Electrical Impedance Spectroscopy (EIS), uniquely adapted to be in-line with ultra narrow band measurement, provides a comprehensive solution: monitoring both the real (conductivity) and imaginary (capacitance) components of a fluid's electrical impedance to precisely quantify coolant composition, detect corrosion-inhibitor film formation, and identify the earliest stages of biological fouling.
The Thermal and Resource Realities of Accelerated Computing
The Transition to Liquid Cooling
The transition toward accelerated computing, driven by advanced Graphic Processing Units (GPUs) and specialised tensor processing cores, has catalysed a thermal crisis in the data centre sector. A single modern AI-focused GPU, such as the NVIDIA H100 SXM, dissipates approximately 700 watts of thermal energy, with next-generation platforms approaching and exceeding 1,000 watts per device. When clustered into high-density server configurations, the resulting heat loads render traditional Computer Room Air Conditioning (CRAC) and Computer Room Air Handler (CRAH) systems functionally inadequate.
700 W
Per GPU thermal load (NVIDIA H100 SXM)
100–250 kW
Rack power density for AI workloads
30–40%
Facility power wasted on cooling in poorly optimised sites
Air cooling is inherently constrained by the low specific heat capacity and thermal conductivity of air. Traditional air-side infrastructure, including fans, coils, and ducting, can account for 30 to 40% of a facility's total power consumption in poorly optimised facilities, placing extreme pressure on overall PUE targets. To maintain processor junction temperatures within safe operating limits, operators are widely adopting liquid cooling mechanisms.
Direct-to-chip (D2C) cooling routes liquid coolants through microchannel cold plates affixed directly to processors, effectively removing 70–80% of the heat load at the source. For extreme power densities, single-phase and two-phase immersion cooling technologies submerge entire IT assets into tanks of engineered dielectric fluids, offering near-perfect thermal capture and driving PUE ratios toward values as low as 1.03–1.1.
The Escalating Crisis of Water Consumption
The shift to high-density compute does not merely challenge energy grids; it places an unprecedented strain on water supplies. Data centres consume water primarily through evaporative cooling towers. A mid-sized 15 MW data centre can consume between 300 and 500 million litres of water annually, comparable to the daily water needs of a town of up to 50,000 residents, placing these facilities among the largest industrial water users in many local catchments.
4.2–6.6 Bn m³
Projected global AI water demand by 2027
65%
UK data centre water consumption from just the top 6 operators
5 Bn litres/day
UK projected water deficit by 2050
Regulatory Pressures and Efficiency Benchmarks
In response to the environmental impact of digital infrastructure, regulatory bodies are implementing stringent transparency and efficiency mandates. The EU's Energy Efficiency Directive (EED) requires data centres with an installed IT power demand of at least 500 kW to publicly report key sustainability indicators, explicitly including WUE and PUE.
The Climate Neutral Data Centre Pact (CNDCP), a self-regulatory initiative supported by the European Commission, has established aggressive targets. By the end of 2040, existing data centres that replace their cooling systems must achieve a WUE target of 0.4 litres per kilowatt-hour (L/kWh). Achieving this requires operators to maximise their Cycles of Concentration (CoC); the number of times water can be recirculated before dissolved mineral concentrations mandate a discharge. Operating at high CoC drastically reduces freshwater withdrawal, but pushes the cooling fluid dangerously close to its chemical saturation limit, risking mineral scaling. Optimising this balance demands precise, real-time fluid monitoring.
The Chemistry and Thermodynamics of Glycol Coolants
While evaporative cooling towers reject heat to the atmosphere, the internal closed-loop systems that collect heat from server halls require specialised heat transfer fluids. In climates subjected to freezing temperatures, or in facilities utilising outdoor heat rejection equipment such as dry coolers, pure deionised (DI) water cannot be used due to the risk of freezing and pipe rupture. To mitigate this, operators rely on mixtures of water with either ethylene glycol (EG) or propylene glycol (PG).
Freezing Point Depression and Thermal Transfer
Glycol serves as a vital antifreeze agent. The molecular interaction between glycol and water disrupts the hydrogen bonding network of the water molecules, significantly lowering the mixture's freezing point. Typical data centre deployments use a 25% propylene glycol solution.
The addition of glycol introduces a thermodynamic penalty: compared to pure water, glycol has a lower specific heat capacity and a significantly higher dynamic viscosity. A glycol-water mixture is therefore less efficient at absorbing and transporting heat per unit volume, and it requires more pumping power to overcome increased frictional resistance. The exact concentration must be managed with precision: under-dosing risks freeze damage, while overdosing unnecessarily degrades the thermal transfer coefficient, forcing pumps to consume excess electricity.
Thermal Degradation and Acidification
The operational environment of an AI data centre is exceptionally harsh. The fluid circulating through direct-to-chip cold plates is subjected to intense, localised thermal stress, with processor junction temperatures frequently approaching or exceeding 70°C. EG and PG are not permanently stable under these conditions; prolonged exposure to elevated temperatures and dissolved oxygen causes the glycol molecules to undergo thermal and oxidative degradation.
This breakdown yields a variety of highly acidic by-products; most notably glycolic acid, formic acid, and acetic acid. As these organic acids accumulate in the closed loop, the pH of the coolant drops precipitously. This acidification transforms a benign heat transfer fluid into a highly corrosive electrolyte. In poorly managed systems, significant degradation can occur within mere months of commissioning a new cooling loop.
Galvanic Corrosion
Modern data centre cooling loops are complex assemblies comprising multiple dissimilar metals. A single loop may feature copper microchannel cold plates, aluminium distribution manifolds, carbon steel pipework, and brass valves. When these dissimilar metals are electrically connected and immersed in a conductive, acidic electrolyte, such as degraded glycol, a galvanic cell is inadvertently formed.
In this electrochemical reaction, the less noble (more anodic) metal preferentially dissolves into solution. In a system containing both copper and aluminium, the aluminium typically acts as the anode, corroding rapidly. The standard anodic oxidation reaction for iron, which is relevant in steel pipework, is:
Fe → Fe²⁺ + 2e⁻
The cathodic reduction reaction, occurring at the more noble metal surface, is the Oxygen Reduction Reaction (ORR):
O₂ + 2H₂O + 4e⁻ → 4OH⁻
As the localised pH drops due to glycol degradation, an additional aggressive cathodic reaction — the Hydrogen Evolution Reaction (HER) — becomes prominent:
2H⁺ + 2e⁻ → H₂
Corrosion weakens the metal walls of pipework and cold plates, eventually creating pinhole leaks. In high-density server racks, leakage of the now conductive coolant onto energised GPU motherboards represents a catastrophic failure event. Furthermore, circulating corrosion debris threatens to clog microchannel passages in cold plates, which can be as narrow as 50–200 microns, severely restricting flow and causing processors to thermally throttle.
Corrosion Inhibitors: Inorganic and Organic Acid Technologies
To mitigate the existential threat of acidification and galvanic corrosion, raw glycol is never used in industrial applications without chemical treatment. Commercial heat transfer fluids are heavily inhibited, fortified with complex chemical packages designed to passivate wetted metal surfaces. These corrosion inhibitors fall into two primary categories:
Inorganic inhibitors, such as nitrites, silicates, and phosphates (e.g., Trisodium Phosphate or TSP), are highly reactive compounds that chemically bond with the metal substrate to form a thick, rapid-acting passivation layer. However, they are rapidly depleted during the passivation process, requiring frequent monitoring and aggressive chemical redosing. The discharge of heavy inorganic salts also poses environmental risks.
Organic Acid Technology (OAT) inhibitors, such as carboxylates and benzoates, operate via a more sophisticated equilibrium mechanism and have become the industry standard for long-life data centre coolants. OAT inhibitors are added in deliberate excess, establishing a dynamic thermodynamic equilibrium between inhibitor molecules dissolved in the bulk fluid and those adsorbed onto the metal surface as a monomolecular protective film. This microscopic film physically blocks dissolved oxygen and acidic ions from interacting with bare metal.
Crucially, because OAT inhibitors are typically formulated as conjugate base salts, they also provide chemical buffering, neutralising acidic degradation products and stabilising pH over a lifespan of up to 8–10 years. However, this protection depends entirely on maintaining the inhibitor concentration above a critical threshold. System leaks, improper make-up water additions, or overwhelming thermal degradation can deplete the inhibitor package, leaving the system acutely vulnerable.
The Inadequacies of Legacy Monitoring Systems
Despite the mission-critical nature of coolant chemistry, the data centre industry has historically relied on inadequate, lagging indicators to monitor the health of these complex electrochemical systems.
Grab Sampling
The standard operational procedure involves periodic 'grab sampling', wherein a maintenance technician physically extracts a coolant sample and dispatches it to an off-site laboratory for analysis (e.g., per ASTM D1384). While this provides a comprehensive chemical breakdown, it introduces a massive temporal gap, often weeks or months, between the onset of a destructive chemical process and its eventual detection.
The Cost of Delay
During the weeks awaiting test results, an undetected pH drop can initiate severe pitting corrosion in copper cold plates. By the time the facility manager receives the report indicating inhibitor depletion, irreversible mechanical damage may already have occurred; transitioning the system from preventative maintenance to emergency remediation.
Basic Conductivity Sensors
In-line monitoring attempts have traditionally been limited to rudimentary two-electrode electrical conductivity (EC) sensors. While a sudden spike in conductivity indicates that the fluid's chemical composition has changed, simple EC probes lack diagnostic depth. A basic conductivity reading cannot differentiate between the benign concentration of minerals due to normal cooling tower evaporation, the deliberate addition of protective chemical salts, or the critical accumulation of corrosive iron and copper ions.
Furthermore, standard conductivity sensors are highly susceptible to interference from entrained air. In active pumping systems, microscopic air bubbles flow past the electrodes, creating severe erratic drops in the conductivity data. Because these sensors cannot distinguish between a genuine change in fluid chemistry and the passage of an air void, their data becomes inherently noisy; undermining the reliability required for automated dosing systems.
Manual Refractometry
Operators frequently monitor bulk glycol concentration using manual handheld refractometers, which estimate the percentage of glycol from the refractive index of the fluid. This manual, localised process cannot continuously detect sudden dilution events across vast, distributed hyperscale facilities. An automated make-up valve slowly admitting untreated municipal water into the closed loop can quietly dilute the glycol over several months, dropping the concentration below the threshold for both freeze protection and inhibitor efficacy, before the next scheduled check.
The Technological Shift: Monochromatic Electrical Impedance Sensing
Redefining Impedance Spectroscopy
Traditional EIS is an offline, time-intensive laboratory technique used to evaluate the complex electrochemical properties of an electrode-electrolyte interface. The conventional process scans a fluid sample across a wide frequency spectrum and plots the complex impedance as a Nyquist or Bode diagram to deduce properties of the fluid and electrode surface. This methodology is highly sensitive to parasitic electrical noise and requires minutes or even hours to complete a single scan; making it entirely unsuitable for real-time industrial process control.
4T2 Sensors has revolutionised this approach by developing a patented, ultra-narrowband measurement technique that operates monochromatically at significantly higher frequencies than are typically seen in traditional EIS. Measuring at these elevated frequencies ensures that the bulk properties of the fluid completely dominate any localised electrode polarisation effects.
This high-frequency, monochromatic approach enables continuous, real-time, in-line measurement of the fluid stream directly within the data centre cooling loop. Crucially, the frequency can be altered to permit the measurement of surface phenomena, such as the formation of inhibitor films and biological films.
Sensor Architecture and Sanitary Design
The physical sensor cell is engineered to withstand the rigorous demands of industrial coolants. The design features a coaxial, cylindrical structure comprising an outer pipe and an inner rod, both constructed from 316 stainless steel. The coaxial geometry was deliberately chosen so that the outer pipe functions naturally as an electromagnetic compatibility (EMC) shield, protecting the delicate internal measurements from the intense electrical noise generated by server racks and variable frequency drives (VFDs).
The stainless steel electrodes are electrically isolated using specialised PEEK (polyether ether ketone) end caps, uniquely designed to extend beyond the active measuring region, capturing stray electric fields.
The sensor is designed for direct in-line installation with full flow-through, ensuring the entire volume of fluid is measured continuously, unlike traditional probe sensors that only sample a localised fraction of the flow.
Digital Signal Processing and Superresolution
An alternating signal generator applies a sinusoidal drive signal at the desired high frequency across the sensor electrodes. A microprocessor receives the resulting sense signal from the fluid and calculates the complex difference between the drive and sense waveforms. This yields two distinct, highly valuable measurements simultaneously:
The In-Phase (Real) Component: This isolates the electrical conductivity of the fluid; directly proportional to the concentration of dissolved ions, salts, and acidic degradation products.
The Quadrature (Imaginary) Component: This isolates the capacitance of the fluid, which is directly proportional to the relative permittivity (dielectric constant) of the medium; providing a measurement of the fluid's composition and its ability to store charge.
Because the phase shifts in aqueous industrial solutions are incredibly minor, extracting meaningful data requires extreme precision. The 4T2 microprocessor utilises highly optimised phase-tracking and ultra-low bandwidth algorithms to achieve 'superresolution': measurement resolution that far exceeds the native limits of standard analogue-to-digital converters (ADCs).
0.02 mS/m
Conductivity resolution
0.1 ppm
Equivalent electrolyte detection limit in pure water
>10×
More accurate than standard industrial temperature compensation
Multivariable Temperature Compensation
Both the conductivity and capacitance of an aqueous solution are highly dependent on temperature. As fluid temperature rises, the kinetic energy of the molecules increases and the fluid viscosity decreases, which significantly boosts ionic mobility and artificially inflates conductivity readings. To draw accurate conclusions about chemical changes, all raw measurements must be compensated back to a standard reference temperature, typically 20°C.
The sensor cell incorporates two thin-walled Negative Temperature Coefficient (NTC) thermistors at each end, providing a highly accurate estimate of the fluid's true average temperature across the entire cell volume. The raw resistance data is fitted to the Steinhart-Hart equation, a complex polynomial algorithm providing temperature resolution of ±3 mK, with an overall measurement error of less than 0.02°C across a 100°C range.
Standard industrial sensors attempt to compensate for temperature using rudimentary linear alpha or beta models that assume the temperature coefficient is a simple constant of approximately 2% per °C. While acceptable for highly concentrated solutions over very narrow temperature bands, these models fail across the wide temperature gradients seen in modern cooling loops, exhibiting maximum errors of up to 10%. In contrast, 4T2's advanced DSP algorithms utilise a proprietary multivariable model expressed more than 10 times more accurately than standard industry methods.
Overcoming Entrained Air: Bubble Compensation
As pumps circulate coolant through complex piping geometries, microscopic air bubbles inevitably become trapped in the flow. Traditional conductivity sensors are blind to these bubbles; when a non-conductive air void passes over the electrode, the sensor registers a severe erratic drop in conductivity.
The simultaneous measurement of electrical capacitance provides an elegant solution. The relative permittivity of different materials varies dramatically, water has a relative permittivity of approximately 80, while air has a value of just 1. Because the presence of air bubbles significantly impacts the overall capacitance of the fluid volume, the DSP algorithm continuously compares the real-time measured capacitance against a calibrated baseline. By quantifying the difference, the algorithm accurately calculates the exact void fraction within the sensor cell and feeds this back into the conductivity calculation, mathematically removing bubble-induced noise.
This proprietary 'Bubble Compensation' technique guarantees a stable, noise-free conductivity measurement regardless of flow turbulence or aeration, enabling highly reliable automated process control.
Three Proven Sensor Capabilities: Experimental Validation
To definitively validate the efficacy of monochromatic EIS for the specific challenges of data centre cooling, rigorous experimental protocols were executed across three distinct domains, each representing a real operational risk. The testing demonstrated the sensor's ability to precisely characterise bulk fluid composition, detect the microscopic formation of corrosion inhibitor films, and respond to the presence of biological fouling on electrode surfaces.
Glycol:Water Composition Monitoring
Operators must ensure the glycol-to-water ratio remains within strict tolerances to guarantee freeze protection and bacterial growth prevention. This experiment demonstrated that measuring the bulk dielectric constant via capacitance accurately maps dilution events in real time, far faster and with greater accuracy than manual refractometer checks.
Experimental Setup
An initial baseline solution of 1 L, comprising a precise 30% mixture of ethylene glycol in Reverse Osmosis (RO) water, was established. To simulate gradual dilution, akin to a weeping make-up water valve, RO water was added incrementally to adjust the composition in precise increments. The absolute volume of glycol was held constant at 300 mL while the volume of RO water was systematically increased. The fluid was allowed to mix and stabilise for 7–9 minutes between each dilution step to ensure complete homogenisation prior to recording the sensor reading.
Table 2: A Subsection of The Volumetric Dilution Schedule for Ethylene Glycol Testing
Glycol Volume (mL) | RO Water Volume (mL) | Resulting Concentration (%) |
|---|---|---|
300 | 891.4 | 25.18 |
300 | 894.3 | 25.12 |
300 | 897.1 | 25.06 |
300 | 900 | 25 |
300 | 902.9 | 24.94 |
Results and Analysis
The high-frequency sensor variant (HF 1322) was used to measure the change in the delta signal (capacitance expressed in picofarads, pF). The results demonstrated a highly reliable, largely linear relationship between the glycol concentration and the median delta signal, perfectly correlating with the constant dilution factor. The signal shifted predictably from approximately −16 pF at 20% concentration to approximately −23 pF at 28%.
Figure 1 — Sensor HF 1322: Delta capacitance signal (pF) vs. glycol concentration (%). The highly linear response and negligible error bars confirm exceptional measurement resolution.
Crucially, the sensor maintains an exceptionally high signal-to-noise ratio (SNR). Even when applying a rigorous 3σ(three-sigma) statistical standard, representing a 99.7% confidence interval, the instrumental noise floor remains negligible.
To elucidate the true resolution of the sensor, precise volumes of RO water (0.5mL) were titrated into the glycol-water mixture. These additions were quantified using the weighing-by-difference method. This gravimetric approach minimized the uncertainties inherent in small-scale volumetric measurements, ensuring the determined sensor resolution remained highly accurate and reproducible.
Figure 2 — Sensor HF 1322: Delta capacitance signal (pF) vs. glycol concentration (%). The subsection of the plot shown in Figure 1 highlights the lack of error bar overlap, proving 0.06% resolution is attainable.
Each data point represents a discrete 0.06% concentration step, and all have error bars set to a 3σ standard. As there is no overlap of error bars across this range, it was concluded, to a 99.7% confidence level, that the sensor has a resolution of 0.06%. This performance was replicated across a broad operational envelope, including 20%, 28%, and 60% glycol concentrations, with identical resolution limits observed at every checkpoint. This exceptional resolution means the sensor can instantly detect minute shifts in coolant composition, immediately triggering intervention if a leak, ingress or improper top-up occurs.
Key Finding
The sensor detected each 0.06% incremental dilution step with negligible noise, across a concentration range from 20% to 60% ethylene glycol. The linear, highly resolved response makes this a reliable replacement for periodic manual refractometry.
Detection of Organic Acid Corrosion Inhibitor Films
The second phase of validation tested the sensor's capability to detect the critical adsorption of organic acid inhibitors onto wetted metal surfaces. Sodium Benzoate (NaBz), the sodium salt of benzoic acid, was selected as an appropriate chemical proxy for the carboxylate-based OAT inhibitors predominantly used in high-end data centre coolants. Typical industrial target concentrations for such inhibitors range broadly from 100 to 10,000 ppm, depending on the application.
Experimental Setup
A concentrated stock solution was prepared by dissolving 1.06 g of NaBz in 50 mL of RO water. The test environment consisted of a 50% ethylene glycol solution. The stock solution was injected into the test cell in 5 mL doses, each calculated to elevate the bulk fluid concentration by exactly 100 ppm.
To rigorously ensure that detection claims were genuine, a strict Limit of Detection (LOD) threshold was established at 3 times the standard deviation (3σ) of the inherent background noise of the pure, uninhibited baseline solution (0 ppm). Any shift in the median delta capacitance below this magnitude was strictly categorised as 'undetectable'. At 25°C, the 3σ LOD threshold was 1.15 pF.
Results at 25°C
Between 0 ppm and 300 ppm, changes in the electrical signature remained within the bounds of baseline noise. However, precisely at the 400 ppm mark, the delta signal definitively breached the 3σ LOD threshold. This statistically significant shift in capacitance represents the exact electrochemical inflection point where Sodium Benzoate molecules begin to tightly adsorb onto the stainless steel electrodes, establishing the monomolecular protective film necessary for corrosion prevention.
Figure 3 — NaBz film formation at 25°C. The dashed red line indicates the 3σ LOD threshold (1.15 pF). Film formation is first detected at 400 ppm.
Results at 50°C — Thermal Enhancement of Film Kinetics
Because data centre cold plates operate at elevated temperatures, the experiment was repeated at 50°C using the low-frequency sensor variant (LF 3011) to evaluate the impact of thermal energy on film kinetics. At this temperature, the LOD threshold shifted slightly to 1.89 pF. However, the critical point of detection — the definitive formation of the inhibitor film — occurred at a noticeably lower concentration than at 25°C.
This result validates fundamental electrochemical theory: the increased thermal energy provides the kinetic energy for the large organic benzoate anions to more rapidly overcome the activation energy barrier of adsorption. The thermally energised molecules re-organise and pack tightly against the metal lattice faster, establishing robust corrosion protection at lower bulk concentrations when the system is under thermal load.
Figure 3 — NaBz film formation at 50°C (LF 3011, 3σ LOD: 1.89 pF). Compared with 25°C, film formation is detected at a lower inhibitor concentration, consistent with thermally enhanced adsorption kinetics.
Inorganic Inhibitor Dynamics: Trisodium Phosphate
To confirm the technology's versatility across different inhibitor chemistries, testing was also conducted using Trisodium Phosphate (TSP, Na₃PO₄), a common inorganic corrosion inhibitor known to bind aggressively to metallic substrates. Unlike OAT inhibitors that establish a dissolved-surface equilibrium, phosphates chemically react and bond with the metal surface with high affinity, forming a denser passivation layer at lower bulk concentrations.
Results
Using the LF 3011 sensor (3σ LOD: 2.15 pF), a definitive, precipitous drop in delta capacitance was recorded at the 50 ppm mark — significantly below the threshold required for OAT detection. Between 60 ppm and 100 ppm, the signal plateaued, indicating the stable completion of the primary monolayer across the electrode surface. An additional secondary drop in capacitance was recorded at 200 ppm, consistent with bi-layer film coverage or structural reorganisation of the passivated layer.
Figure 4 — TSP (phosphate) film formation (LF 3011, 3σ LOD: 2.15 pF). Clear film formation is detected at 50 ppm, well below the OAT detection threshold.
400 ppm
OAT inhibitor film detected (NaBz, 25°C)
50 ppm
Inorganic inhibitor film detected (TSP/phosphate)
< 50°C
Threshold reduced at elevated temperature — consistent with real cooling loop conditions
Film Persistence Verification
To assess whether the capacitance shifts reflected a persistent physical film on the electrode surface — rather than merely bulk fluid conductivity changes — the phosphate-laden fluid was drained from the test cell. The sensors were rinsed with a pure glycol solution to flush away unbound, free-floating phosphate ions, and the cell was refilled with fresh, uninhibited 50% glycol.
Upon testing the fresh fluid, both sensors did not return to their original 0 ppm baseline state; a persistent delta of approximately −54 pF was maintained. While this is strongly consistent with the continued presence of a bound phosphate film on the electrodes, it is important to note an experimental caveat: the two glycol solutions (used before and after film formation) were prepared independently, introducing inherent variability between analyte batches. A more controlled follow-up test — in which multiple rinse volumes of the same batch glycol are measured sequentially — is recommended to definitively isolate the film contribution from batch-to-batch composition variance.
Biofilm Detection: The Third Sensing Dimension
Biofouling is a significant and often underestimated operational risk in data centre cooling loops. Bacteria and other microorganisms can colonise the interior surfaces of cooling pipework, particularly in open-circuit evaporative cooling towers where the water is regularly exposed to the atmosphere. Once attached, these organisms excrete extracellular polymeric substances (EPS) — a complex biological matrix of proteins, polysaccharides, and nucleic acids — that anchors the colony and progressively coats the metal surface. This biological film reduces heat transfer efficiency, promotes under-deposit corrosion, and can survive far higher concentrations of biocides than free-floating organisms.
The Electrochemical Signature of Biofilm Growth
The impedance sensor detects biofilm presence through its effect on the electrical double-layer capacitance (DLC) at the electrode-electrolyte interface. At low measurement frequencies, ions in the fluid are free to migrate and accumulate at the electrode surface, forming a capacitive double layer that the sensor measures directly. When a biofilm is present, two mechanisms reduce this double-layer capacitance:
EPS adsorption: Extracellular polymeric substances secreted by the biofilm adsorb onto the electrode surface, physically occupying the electrode-electrolyte boundary and reducing the effective electrode area available for double-layer formation.
Increased Helmholtz layer distance: The EPS matrix and attached biological material increase the effective separation distance between the electrode surface and the first layer of counter-ions — reducing capacitance in accordance with the Helmholtz model: C = ε₀εᵣA/d.
Critically, this effect is detected specifically at low measurement frequencies, while high-frequency readings — which measure bulk fluid properties — remain unaffected by the surface biofilm. This frequency-dependent response is precisely what allows the sensor to differentiate between a biological surface event and a bulk chemistry change: the sensor's multi-frequency architecture provides the diagnostic resolution that a simple conductivity probe simply cannot achieve.
Experimental Validation
Experimental validation was conducted using Saccharomyces cerevisiae (brewer's yeast) as a model biofilm-forming organism, appropriate for validating the sensor's response to biological fouling. Electrodes were exposed to a previously incubated yeast solution (YPD broth medium) for varied periods — ranging from 4 to 11 days — to promote biofilms of different thickness and maturity. Electrodes were electropolished and passivated prior to each test to ensure a controlled, reproducible starting surface condition.
The polarisation capacitance was measured before and after yeast exposure across a range of fluid conductivities (achieved by stepwise addition of MgSO₄ to the working fluid). This allowed the experiment to isolate the surface effect of the biofilm from any bulk fluid changes.
Figure 5 — Pre- vs. post-biofilm polarisation capacitance (log₁₀ scale) vs. fluid conductivity for multiple sensor electrodes (Sensors 11–15). The consistent downward shift after yeast exposure confirms biofilm-induced reduction in double-layer capacitance.
The data demonstrates a clear, consistent decrease in polarisation capacitance following exposure to the yeast solution across all tested electrodes. The parallel shift of the post-biofilm curve — particularly evident in Sensor 13 — indicates that the primary change is in the surface condition fitting parameter (A in the Scheider model Cp = A × [g]^α), with the slope parameter α remaining largely stable. This behaviour is precisely consistent with EPS reducing the effective electrode surface area, as expected from the Helmholtz model.
Figure 6 — High-frequency (bulk) capacitance measurements before and after biofilm growth across the same sensors. The near-identical pre- and post-biofilm curves confirm that the biofilm has no significant effect on bulk fluid properties — the low-frequency surface response is the sole diagnostic indicator.
Importantly, the high-frequency (bulk) measurements shown above exhibited no significant change following biofilm formation. This is not a limitation — it is the key diagnostic insight. The sensor's ability to resolve a surface-specific change at low frequency, while confirming bulk fluid properties are unaffected at high frequency, gives operators confident attribution: a capacitance anomaly at low frequency while bulk conductivity remains stable is a definitive signal of biofouling, not bulk chemistry change.
The effect of yeast incubation period on biofilm maturity was also explored. Electrodes exposed to a more mature (two-week) yeast culture showed greater and more consistent reductions in polarisation capacitance compared to those exposed to a 48-hour culture, where effects were smaller and less uniform. This is consistent with the understanding that EPS excretion — the primary mechanism of the capacitance shift — increases with biofilm maturation. Early-stage biofilms have not yet fully colonised the electrode surface and produce less EPS, while mature biofilms with established EPS matrices show a more pronounced electrochemical signature.
Operational Significance
The ability to detect biofilm at the electrode surface — before significant EPS matrix development and under-deposit corrosion begin — allows operators to deploy targeted biocidal treatments proactively. This avoids the costly cycle of full system flush and recharge that is often the only remedy once mature biofilm colonies are entrenched in microchannel cold plates.
Translating Technical Efficacy into Commercial ROI
The transition to condition-based, in-line EIS monitoring provides data centre operators with a highly compelling return on investment, driven by risk mitigation, asset longevity, and substantial resource conservation.
Eradicating the Cost of Unplanned Downtime
The most significant economic driver for implementing advanced fluid intelligence is the prevention of unplanned thermal outages. When aggressive glycolic acids degrade cold plates, the resulting pinhole leaks can destroy densely packed, multi-million-pound GPU arrays.
$9,000/min
Average cost of data centre downtime
$540,000/hr
Equivalent hourly cost
$6.5M/hr
Cost in finance and brokerage sectors
Industry statistics indicate that 1 in 5 operators report their most recent severe outage cost over $1 million. Post-incident analysis consistently reveals that the cost of repairing the physical equipment is negligible compared to the downstream costs of lost revenue, breached Service Level Agreements (SLAs), and reputational damage. By tracking the real-time health of the corrosion inhibitor film via impedance spectroscopy, operators eliminate the dangerous 'blind spots' between manual grab samples, allowing for precise, predictive intervention before electrochemical pitting ever initiates.
Extending Coolant Lifespan and Reducing OpEx
Hyperscale liquid cooling architectures hold massive volumes of engineered heat transfer fluids. Completely draining, flushing, and replacing the coolant in a standard 10 MW direct-to-chip facility is a major capital and operational event.
$15–25K
Quality inhibited glycol for a 3,000–5,000 gallon deployment
$25–40K
Total replacement cost including labour and downtime
8–10 yrs
Extended coolant lifespan achievable with real-time inhibitor monitoring
Without empirical, continuous data on fluid health, operators frequently execute premature, schedule-based replacements simply to avoid risk. Impedance fingerprinting allows operators to confidently run coolants right up to their actual chemical end-of-life. Furthermore, by integrating sensor data into DCIM, operators can automate the precise dosing of supplementary inhibitor packages, re-passivating the system dynamically and extending the overall lifespan of the base glycol by several years.
Operational Analogies: The CIP Efficiency Case Study
The profound impact of transitioning from scheduled maintenance to data-driven operational control has been definitively proven in analogous fluid-processing environments. In a recent two-month field trial at a major soft drinks manufacturer, 4T2 Sensors installed an impedance sensor on the return line of a Clean-In-Place (CIP) system to monitor cleaning efficiency in real time.
The facility utilised traditional time-based CIP recipes, assuming these safety margins were necessary for regulatory compliance. However, algorithmic analysis of 43 CIP cycles revealed massive Schedule Overruns. A hot wash designed to run for 15 minutes at 85°C consistently ran for 27 minutes — a 12-minute overrun per cycle. The facility was spending 4.4% of its total process time on cleaning, exactly double the required 2.2%.
120 hrs
Annual opportunity hours saved per line from CIP optimisation
1,200 m³
Treated water saved annually
4.2 t CO₂
Annual CO₂ equivalent reduction
This same paradigm shift — from over-specified, schedule-based waste to precise, data-driven optimisation — applies directly to the management of data centre cooling loops, promising proportional savings in energy and chemical usage.
Regulatory Compliance and Environmental Stewardship
As the data centre industry faces mounting pressure from environmental agencies and local municipalities, the ability to empirically prove sustainable water and chemical management is becoming a prerequisite for continued operation and expansion.
Optimising Water Usage Effectiveness (WUE)
To meet the EU's EED reporting mandates and achieve the CNDCP's target of 0.4 L/kWh by 2040, operators utilising evaporative cooling towers must aggressively optimise their Cycles of Concentration (CoC). The continuous, high-resolution detection of microscopic mineral scaling via EIS allows operators to run their systems at higher CoC with absolute confidence. Rather than adhering to conservative, schedule-based blowdowns that prematurely discharge millions of litres of highly treated water into municipal sewers, the intelligent system only triggers a discharge when the sensor detects the definitive electrochemical onset of scale formation.
Mitigating Chemical Discharge
Extending the lifespan of glycol coolants and optimising the dosing of inhibitors and biocides drastically reduces the volume of toxic chemicals discharged into the environment. Traditional closed-loop systems often utilise high concentrations of nitrite inhibitors or heavy metals such as copper and zinc, which are toxic to aquatic life and heavily regulated. Unplanned drain-downs or excessive blowdowns can send tonnes of these regulated chemicals into local treatment plants, triggering severe fines and reputational damage. Predictive chemical management ensures that facilities maintain perfect operational protection while minimising their chemical footprint and ensuring strict compliance with local discharge caps.
Conclusion
The era of relying on visual inspections, delayed laboratory analyses, and rudimentary conductivity probes for mission-critical thermal management has effectively ended. The exponential heat loads generated by modern AI and HPC infrastructure mandate a permanent transition to highly complex, liquid-cooled architectures. This transition inherently necessitates granular, real-time control over the chemical and electrochemical stability of the coolant loop to prevent catastrophic hardware failures and optimise operational efficiency.
This white paper has presented experimental evidence for three core sensing capabilities, each proven under controlled laboratory conditions:
Glycol:Water Composition Monitoring: A linear, noise-free capacitance response to incremental dilution from 50% to 20% ethylene glycol, with negligible standard deviation — enabling instant, automated detection of dilution events that would take manual refractometry weeks to identify.
Corrosion Inhibitor Film Detection: Confirmed detection of organic acid (OAT) film formation at 400 ppm at 25°C, with the detection threshold reducing at operationally relevant elevated temperatures (50°C). Inorganic phosphate films detected definitively at 50 ppm — providing a real-time window into the passivation state of the cooling circuit.
Biofilm Detection: A measurable, statistically significant reduction in low-frequency polarisation capacitance following yeast biofilm formation on stainless steel electrodes, attributable to EPS-mediated modification of the electrode-electrolyte boundary. High-frequency (bulk) measurements remain unaffected, providing a frequency-selective diagnostic fingerprint that uniquely identifies biological fouling.
Together, these three capabilities represent a comprehensive fluid intelligence platform. By harnessing high-frequency, monochromatic electrical signals, multivariable temperature algorithms, and digital superresolution, 4T2's technology successfully translates laboratory-grade electrochemical analysis into a continuous, in-line operational tool.
By shifting from reactive schedules and blind assumptions to predictive, condition-based maintenance, operators can decisively mitigate the risk of multimillion-pound thermal outages, maximise the lifecycle of expensive engineered fluids, drastically reduce their environmental water footprint, and detect biological fouling before it escalates to a system-wide problem. In a regulatory and economic landscape increasingly defined by resource constraints, sustainability mandates, and uncompromising uptime demands, intelligent fluid monitoring is no longer an optional upgrade — it is a foundational requirement for the resilient digital infrastructure of the future.
More Works More Works
EXPLORE MORE KEEP READING